Standard deviation and variance in betting give punters a methodical, statistical way to predict outcomes of sports events. Looking at data and understanding averages is obviously useful when placing bets, but averages don't always tell the full story as outliers exist (like a rare 7-0 thrashing in a football match), which can distort results and add potential risk to your overall betting strategy.
In this article, we'll explore standard deviation and variance, and show you how to integrate it into your bankroll management process when betting online.
What is Standard Deviation?
Standard deviation is a quantity that expresses how much and how often the value of a set of numbers differ from the mean value (or simple average). It can be expressed as the square root of variance.
Of course, now we need to define variance.
Variance
Let’s imagine two groups of people. Both groups have an average height of 180 cm.
Group A could consist of tall people of 190 to 200 cm, ‘average’ people between 170 and 190 cm and short people, from 140 to 170 cm. Group B could consist of only people between 170 and 190 cm.
If you choose someone from group B, you are likely to find someone whose height is roughly 180 cm. If you choose someone from group A, you will find much more fluctuation.
This fluctuation is known as variance, the bigger the variance, the more numbers will differ from the expected value.
Calculating Standard Deviation
Let us look at a hypothetical example. Over the course of 10 matches, a football team scores 3, 0, 1, 0, 4, 2, 6, 2, 0, 3 goals.
Step 1: Calculate the Mean
To calculate standard Deviation, we first need to calculate the mean.
This is very easy as we simply add up the number of goals and divide it by the number of matches.
(3 + 0 + 1 + 0 + 4 + 2 + 6 + 2 + 0 + 3) ÷ 10
That is a total of 21 goals, or an average of 2.1 goals per match.
Step 2: Calculate each result’s difference from the mean
That gives us the following numbers:
+0.9, -2.1, -1.1, -2.1, +1.9, -0.1, +3.9, +1.9, -2.1, +0.9
(for example 3 – 2.1 = 0.9)
Step 3: Calculate the Variance
To calculate the Variance, simply take each difference, square it, and then average the result.
Variance = σ2
=(0.9)2 + (2.1)2 + (1.1)2 + (2.1)2 + (1.9)2 + (0.1)2 + (3.9)2 + (1.9)2 + (-2.1)2 + (0.9)2
÷10= 0.81 + 4.41 + 1.21 + 4.41 + 3.61 + 0.01 + 15.21 + 3.61 + 4.41 + 0.81
÷10= 34.9/10 = 3.49
Step 4: Standard Deviation is the square root of variance.
σ = √3.49 = 1.8681541692269
Standard Deviation Formula
All of the above is summed up in this formula.
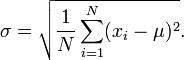
-

N is the sample size (10 in our example)
-
Σ is the Sum symbol
-
xi is the mean
-
µ is each result’s difference from the mean
Standard Deviation Calculator
Instead of doing all of this math yourself, you can simply use this. Click on Population and then on Calculate.
Distribution models: Poisson versus Normal Distribution
You can use Poisson Distribution to predict the likelihood of various outcomes in a football match. However, this distribution has a major flaw: since it only relies on averages (i.e. league average home away or goals, average team average home or away goals).
Normal Distribution is based on two parameters, the average and standard deviation. Normal distribution is what is used to create Bell or Gaussian distribution. This makes it an effective tool for predictions.
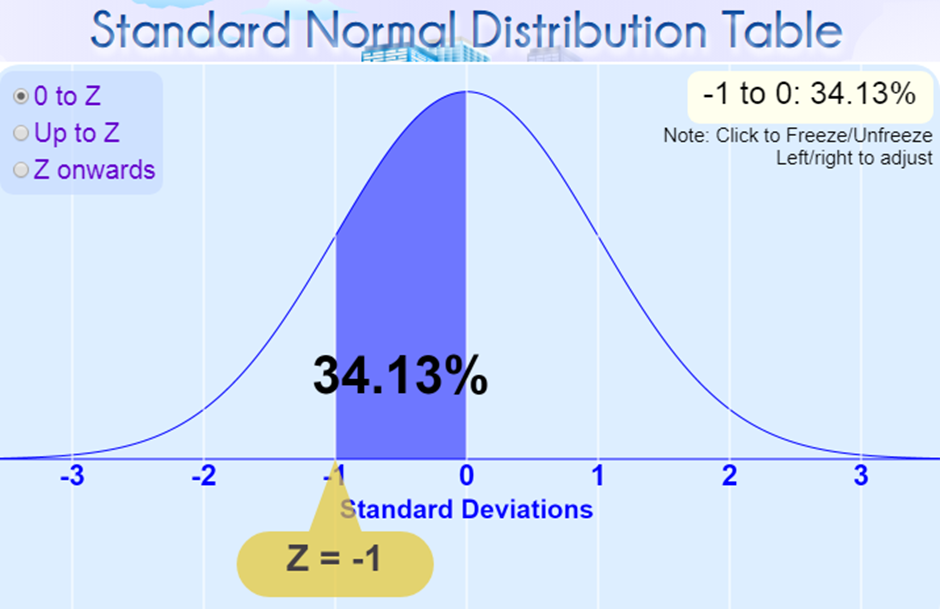
Normal Distribution
In normal distribution:
-
68.26% will be within 1 standard deviation from the mean.
-
31.74% will be more than 1 standard deviation from the mean.
-
95.4% will be within 2 standard deviations from the mean.
-
99.7% will be within 3 standard deviations from the mean.
How to Use Standard Deviation for Betting
Now that we have a mathematical way of expressing how much a score is likely to deviate from the average, and by how much, let us see how to apply this strategy to sports betting.
Calculating Goal Expectancy in Football
Using various types of data, you can create your own normal distribution curves to predict the likely outcome of various events. One example is goals scored. From our example above, we know that 68.26% of the time, goals will be within 1.87 from 2.1. That means it is highly likely that our imaginary team will score at least one goal in the match.
Various Applications in Betting
Standard Deviation, Variance and Normal Distribution have various applications for calculating the likelihood of various sports statistics.
Here is a tutorial on how to create a bell curve in Excel using your own data.
Once you have an up to date normal distribution curve, based on sufficient data, you can easily calculate the likelihood of any game statistic; for example, goals scored, goals allowed, corners allowed, shots on goal, etc.
ThePuntersPage Final Say
Using standard deviation is a good alternative to Poisson Distribution for calculating goal expectancy or other game stats. It shows you how likely results will differ from the mean. By using a second variable (variance) instead of only averages, we get a nuanced result.
If you plan to bet on game statistics, you could consider adding analysis based on Standard Deviation to your handicapping arsenal. It can be a useful tool for analysing risk and seeking value bets. Remember that the bigger the sample size, the more accurate it is.
Standard Deviation and Variance FAQs
Standard deviation tells you how far variables in a set of numbers are spread out from the average (mean), or expected value. A low standard deviation implies that most numbers are close to the mean. A high standard deviation means most numbers are far from the mean. In terms of sports statistics, Standard Deviation tells you how results are distributed compared to the mean. For example corners allowed in football.
N is the sample size (10 in our example) Σ is the Sum symbol xi is the mean µ is each result’s difference from the mean
Punters can use standard deviation to calculate how likely it is that a statistic in sports will differ from the mean, and what the variance is. You can also use it to determine odds, assess volatility and your performance as a punter.
Variance is the unpredictability associated with small sample sizes. A coin has odds of 50% to land on heads or tails. However, over the course of 10 or 100 flips, it will not always be a 50/50 distribution. Variance is a number that explains how the various possible outcomes of a number of coin flips are distributed.